
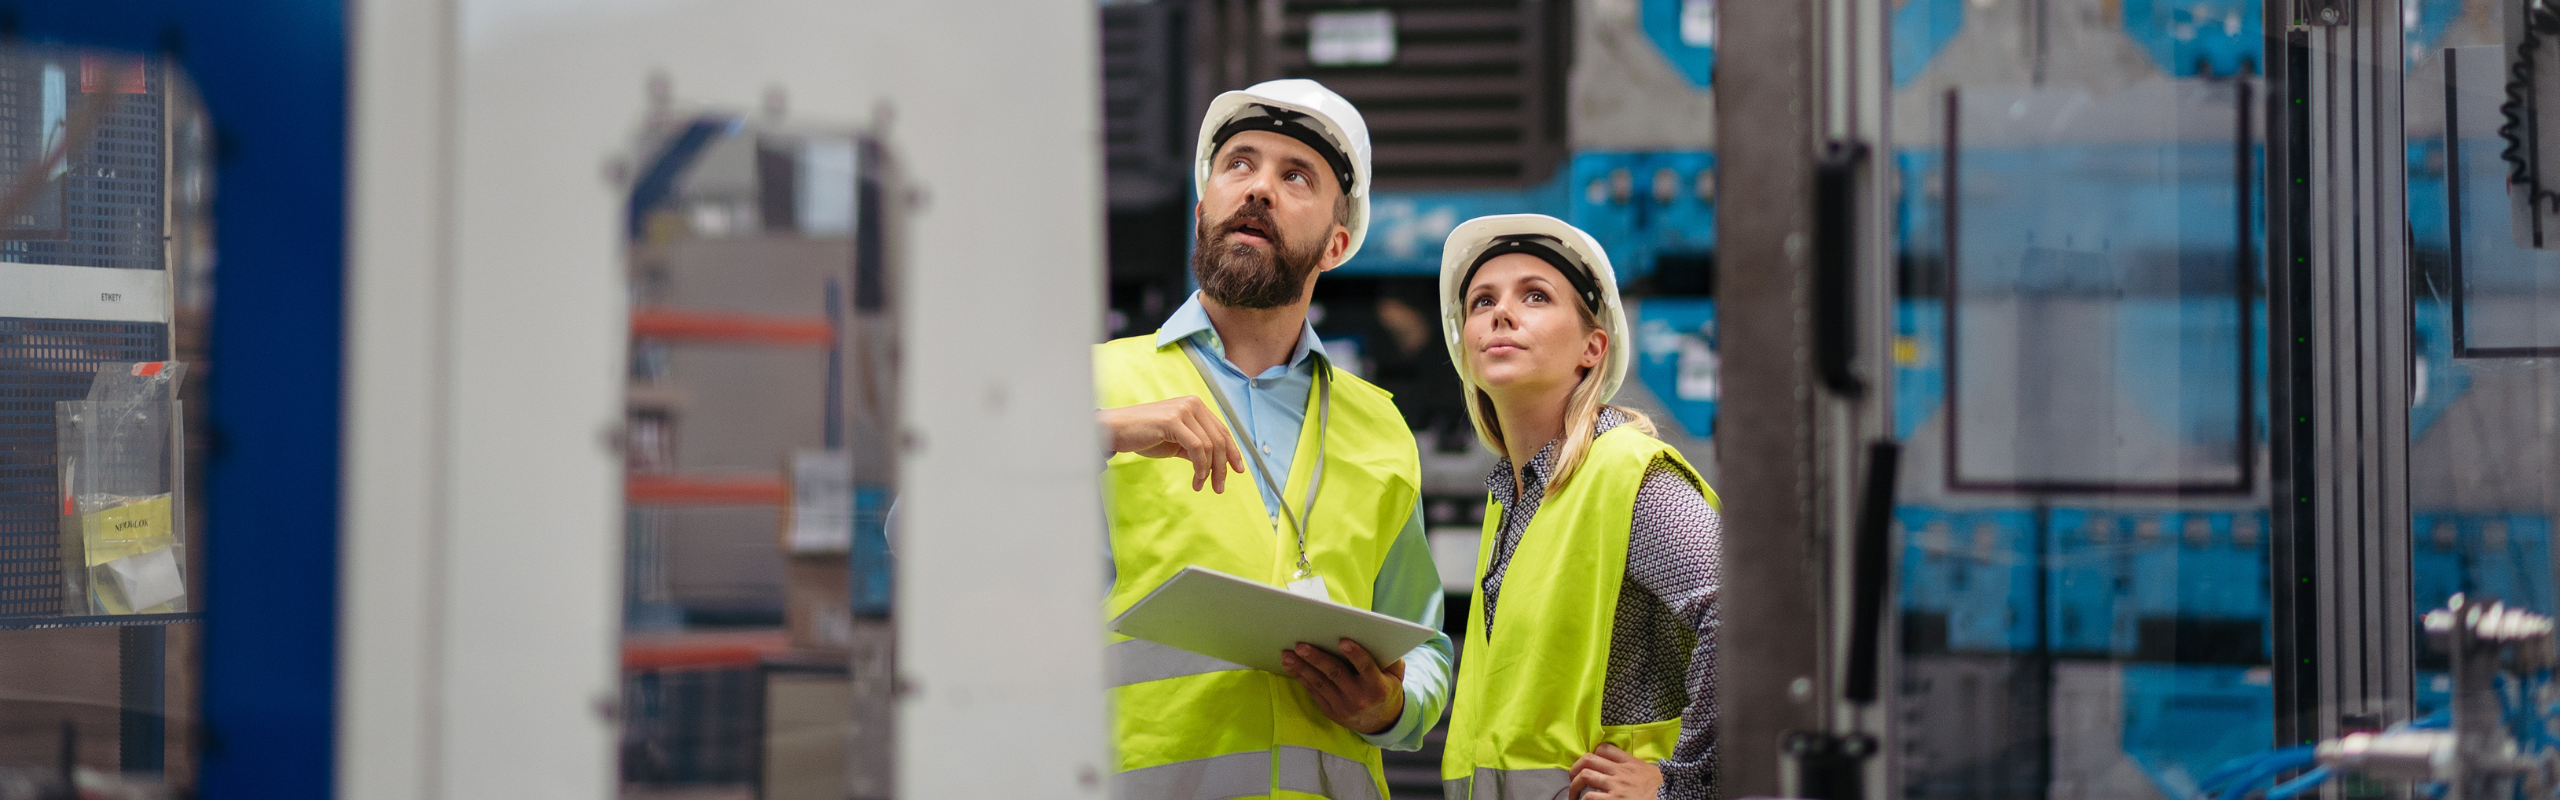
Industrial Team Analyzing Data in High Tech Manufacturing Plant.

The True Cost of a Lack of Data. All About the Role of OEE and TEEP Indicators

"If you can't measure it, you can't improve it." It is hard to disagree with the words of the CEO of one of the factories we have worked with. Without precise data regarding the time and money spent on production downtime, it is difficult to maintain control over the performance of your machinery park.

Moreover, simply having an ERP system will not solve the problem if the production floor lacks MES-class tools. True control over production begins with properly defining downtime categories. It is also necessary to distinguish between key performance indicators – OEE and TEEP.

OEE and TEEP Indicators – What Do They Measure and How Do They Differ?

Understanding the current equipment effectiveness at the level of a production shift requires the use of appropriate indicators. In the case of the Operator Platform, the Machine Status Monitoring module allows for an in-depth analysis using two key measures:

  • OEE (Overall Equipment Effectiveness) - This indicator is based exclusively on the scheduled production time. It shows the utilization of a machine during the time it was actually scheduled to run. OEE consists of three components: availability, performance, and quality. If a machine runs for one shift (8 hours) and achieves ideal parameters during this time, its OEE will be 100%. Thus, the indicator allows not only for the optimization of production but also for the identification of losses during the shift.
  • TEEP (Total Effective Equipment Performance) - A measure that takes into account the total calendar time – 24 hours a day, 7 days a week, 365 days a year. Therefore, it shows the maximum potential of the factory, taking into account so-called planned losses (e.g., holiday breaks). Because of this, a machine that runs for one 8-hour shift a day will have a TEEP of only 33%. This is due to the fact that it is turned off for the remaining 16 hours.

Why is this so important? OEE shows where we are losing money due to breakdowns, changeovers, and micro-stops. TEEP, on the other hand, reveals the hidden capacity of the factory. It often proves that instead of spending millions on new production lines, it is enough to invest in an additional shift or optimize planning in the ERP system.

How to Properly Categorize Downtime?

Before we start analyzing the smallest micro-stops, the main groups of line stoppages must be properly defined. Implementing a system like Operator MES forces an organization to structure its losses.

The foundation is a clear division into planned and unplanned downtime. Planned downtime includes machine changeovers, scheduled maintenance, or employees' breakfast breaks. Unplanned downtime, on the other hand, includes mechanical failures, speed losses, and shortages of production materials.

Thanks to the Operator Datalogger module, connected to terminals on the shop floors, the system gains full context:

  • Cause tree – Downtimes are categorized hierarchically, which allows for the analysis of the sources and frequencies of individual events.
  • Context from the operator – Using a terminal, the operator manually assigns a detailed cause code. They can also add notes, which may concern, for example, the machine operating at a reduced speed.
  • The truth about changeovers – The system precisely separates actual production time from machine setup time. This is often the largest area of hidden losses in manufacturing plants.

A Step into the Future with AI

Once manufacturing plants master the basics – defining downtimes and starting to measure OEE and TEEP – they can reach for the most advanced tools. The Operator OEE solution, integrated with the Manufacturing Intelligence platform, offers support at the level of artificial intelligence.

Machine learning algorithms provide optimization recommendations based on historical data and performance patterns. The ACIP (Automated Continuous Improvement Process) mechanism uses AI to predict potential quality problems and anomalies in machine operation.

Are you looking for a technology partner who can help with the proper implementation of an MES system and a precise downtime grid? We encourage you to contact us and schedule a software demo.

Comments (0)

Leave your comment

No comments here yet, start first!

Leave your comment
Add the comment

You may also read:

How to Automate Machine Data Collection?

Machine data collection is the foundation of reliable OEE (Overall Equipment Effectiveness) analysis. Without it, it is hard to speak of proper control over factory efficiency. How can this be properly automated so that analytics are no longer based on guessing and manual reporting? Automated data acquisition drastically changes daily work on the shop floor, significantly streamlining it. The system is the first to notice a failure. Instead of forcing an employee to manually record the start and end times of a downtime, the software automatically registers every stop, even the shortest ones. The very nature of the operator’s work also changes. With digitalization, their task is reduced solely to categorizing the event that occurred. It is worth noting that in modern implementations, the downtime reason code itself can be delivered to the system automatically, directly from the machine (e.g., via communication protocols such as OPC). In such cases, the employee simply verifies the correctness of the automatically assigned code on a dedicated touchscreen. They can also leave their own comment or note, which supplements the raw machine data with unique context. What Is the Significance of Machine Data Collection For Analytics? Depending on the machine type, systems can collect a single key signal or a whole range of them. The Operator Datalogger module allows for the collection of various production and environmental metrics. Even seemingly simple information can provide key business insights: Machine operating status – for example, this can be determined based on measuring the energy consumption of a machine tool spindle. Number of cycles (takt times) – counted, for instance, based on every pedal press by a press brake operator. Automatic error and downtime codes – if these are generated by the machine, the system helps identify the cause of the production stop. A specific error code immediately appears on the digital screen. Process and environmental parameters – such as current temperature, pressure, voltage, humidity, or shaft speed. These are recorded from sensors in real-time. Thanks to built-in algorithms, these basic signals are analyzed in real-time. This allows for the precise identification of machine availability issues, such as breakdowns, unplanned downtimes, or speed drops. Statistical Process Control – What Is It All About? Monitoring efficiency using the OEE indicator is only half the battle. Gathering process and environmental data directly from the workstation is equally important. This is the purpose of Statistical Process Control (SPC), a method of monitoring a process using statistical data aimed at verifying whether the process is behaving stably and predictably, or if unusual disturbances are occurring. Implementing the SPC module in an MES (Manufacturing Execution System) allows for continuous tracking of variability—that is, differences resulting from material properties, micro-fluctuations in temperature, standard machine and operator work, etc. Crucially, the software measures process stability and allows for the early identification of a problem before parameters exceed nominal critical values and control limits. The system analyzes deviations based on advanced statistical rules, e.g., the three-sigma rule. This solution makes it possible to catch deviations and problems before they negatively impact the final product, significantly reducing waste. Additionally, the system sends proactive alerts. When the value of a monitored machine parameter exceeds a set level, the system automatically generates notifications via email, SMS, or as an alarm on dashboards. However, it is worth remembering that simply implementing software for automated machine data analysis will not fully replace the SPC methodology. In reality, Statistical Process Control is a much broader engineering approach, encompassing, among other things, conducting a reliable measurement system analysis. An MES system like the Operator Platform provides an incredibly powerful tool that helps quickly catch process instability. However, the foundation of success remains the implementation of the SPC culture and comprehensive methodology itself by the engineers at the manufacturing plant. How to Communicate with a Machine Effectively? The method of data acquisition strictly depends on analytical expectations. The Operator Platform supports a wide spectrum of communication protocols. The most effective and recommended solution is direct communication via OPC / OPC UA or a modern IoT protocol, such as MQTT. These ensure seamless, real-time data transmission. Alternative solutions also exist. The system can be integrated with machines through direct database connections, REST API services, or even file interfaces (e.g., CSV, XML). However, one must keep in mind the technological limitations of each method. If the business goal is to capture micro-stoppages lasting just a few seconds, relying on importing CSV files generated by the machine every minute will be technically insufficient. In such cases, real-time communication is essential. An Older Machine Park Is Not a Dead End Many manufacturers fear that the lack of modern interfaces in older equipment makes digitalization impossible. Nothing could be further from the truth. When direct access to data from a PLC controller is difficult, there are several proven integration paths: Software modification – interfering with the controllers’ source code (usually possible for machines to which the plant has full access and rights). Cooperation with the supplier – establishing direct contact with the machine manufacturer to make the appropriate registers accessible. Retrofitting with sensors (“Sensorization”) – the most universal solution. It involves equipping older equipment with independent, modern sensors connected to an external data analyzer or I/O module. These elements translate the machine’s physical operation into digital signals understandable by the MES system. Full Partnership Support The approach to the digital transformation of a production hall must be flexible. The Operator Platform enables the implementation of all the hardware integration variants mentioned above. Regardless of the machine park’s age and the communication protocols used, our software successfully transforms raw machine signals into reliable indicators, providing management with the knowledge necessary to make accurate business decisions.
Two people in business attire overlook a vast automated factory floor filled with rows of manufacturing machines.
Operator
zweryfikowano

0/5

OPERATOR SYSTEMS A/S

Accelerated Improvement


Central Europe
+1
50 people
View profile
Industry
Automotive, Meblarska, Produkcyjna, Spożywcza FMCG, Produkcja maszyn, Produkcja zaawansowanych technologii i elektroniki, Cyfrowa transformacja przedsiębiorstw
expand